Your on-line source for reliable and unbiased information about the evaluation & treatment of heart disease.
How is an Isotope Stress Test performed?
Preparing for the test?
How long does it take?
How safe is it?
What is the reliability of the test?
How quickly will I get the results?
Show me a panoramic view of the lab
How does an Isotope Stress Test Work? An isotope stress test is also known as a nuclear, thallium, Cardiololite, Myoview or dual isotope stress test, depending upon the method used.
During exercise, healthy coronary arteries dilate (develop a more open channel) more than an artery that has a blockage. This unequal dilation causes more blood to be delivered to heart muscle supplied by the normal artery. In contrast, narrowed arteries end up supplying reduced flow to its area of distribution. This reduced flow causes the involved muscle to "starve" during exercise. The "starvation" may produce symptoms (like chest discomfort or inappropriate shortness of breath), and EKG abnormalities. When a "perfusion tracer" (a nuclear isotope that travels to heart muscle with blood flow) is injected intravenously, it is extracted by the heart muscle in proportion to the flow of blood.
The amount of tracer uptake helps differentiate normal muscle (which receives more of the tracer) from the reduced uptake demonstrated by muscle that is supplied by a narrowed coronary artery. In other words, areas of the heart that have adequate blood flow quickly picks up the tracer material. In contrast, muscle with reduced blood flow pick up the tracer slowly or not at all. Analysis of the images of the heart (taken by a scanning camera) can help identify the location, severity and extent of reduced blood flow to the heart. The reduced blood flow is known as ischemia (pronounced is-keem-ya).
![]()
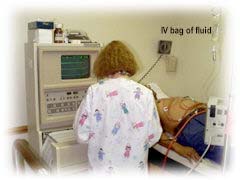
How is an Isotope or Nuclear Stress Test performed? The test is actually divided into three parts: A treadmill stress test, imaging at rest, and imaging after exercise. There are two common types of isotope used in the USA. They are thallium and technetium (which are marketed under the Trade names "Cardiolite" and "Myoview"). Some laboratories use a "dual isotope" technique, where thallium is used for the resting images and technetium is used for the stress pictures. Depending upon the isotope and protocol for the laboratory, resting images may be obtained either before stress or two to four hours after stress. The preparation for the test and the treadmill procedure is similar to that described under the Regular Treadmill Stress Test section. In patients who are unable to complete a high level of exercise because of physical limitations, stress to the heart is provided by pharmaceutical or chemical stimulation.
![]()
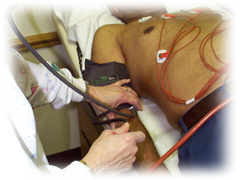
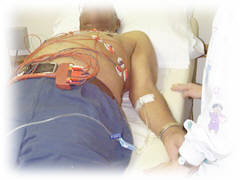
The patient is brought to the exercise laboratory where the heart rate and blood pressure are recorded at rest. Sticky electrodes are attached to the chest, shoulders and hips and connected to the EKG portion of the Stress test machine. A 12-lead EKG is recorded on paper. Each lead of the EKG represents a different portion of the heart, with adjacent leads representing a single wall (see Regular Treadmill for details). The treadmill is then started at a relatively slow "warm-up" speed. The treadmill speed and it's slope or inclination are increased every three minutes according to a preprogrammed protocol. Bruce is the commonest protocol in the USA, but several other protocols are perfectly acceptable (see Regular Treadmill for details). . It is the protocol that dictates the precise speed and slope. Each three minute interval is known as a Stage (Stage 1, Stage 2, Stage 3, etc. Thus a patient completing Stage 3 has exercised for 3 x 3 = 9 minutes). The patient's blood pressure is recorded during the second minute of each Stage. However, it may be recorded more frequently if the patient's reading is outside too high or too low.
The EKG is constantly displayed on the monitor. It is also recorded on paper at one minute intervals. The physician pays particular attention to the heart rate, blood pressure, changes in the EKG pattern, irregular heart rhythm, and the patient's appearance and symptoms. The treadmill is stopped when the patient achieves a target heart rate (this is 85% of the maximal heart rate predicted for the patient's age). However, if the patient is doing extremely well at peak exercise, the treadmill test may be continued further. The test may be stopped prior to achievement of the target heart rate if the patient develops significant chest discomfort, shortness of breath, dizziness, unsteady gait, etc., or if the EKG shows alarming changes or serious abnormal heart rhythm. It may also be stopped if the blood pressure (BP) rises or falls beyond acceptable limits.
![]()
Approximately one to 1 1/2 minutes prior to termination of exercise, the perfusion tracer or isotope is injected into the intravenous "plug" that had been placed in the forearm or hand. This is followed by a "flush" injection of saline (salt water) to make sure that all of the tracer is pushed into the blood circulation. After a brief waiting phase (that allows the tracer to be taken up by the heart muscle) the patient is placed under a scanning camera.
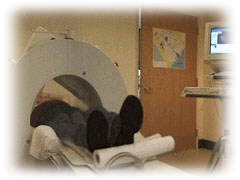
Two sets of isotope images are obtained. One at rest, and one following exercise. Depending upon the isotope used and the protocol for a particular laboratory, the resting images may be obtained before the stress test, or a few hours later. The scanning camera rotates around the patient's chest, stopping to take individual pictures. The patient needs to lay flat and still during the scanning period which takes approximately 11 to 20 minutes, depending upon the type of scanning camera. Patients with severe claustrophobia should notify their physician (a mild tranquilizer before the test may minimize discomfort).
The pictures or images are fed into a computer, which reconstructs them as "slices" of a three dimensional heart. These slices are presented in three views (vertical long axis or VLA, horizontal long axis or HLA and short axis or SA). It also computes the data and presents an aggregate "bull's eye" picture that compares the information to a data base of known normal cases. Areas that fall out side the expected normal range is presented as a blacked out area. In other words, your physician has an opportunity to view a three dimensional representation of your heart, examine individual "slices" and then compare the findings against those computed by the computer as "blackout plots. By comparing one wall against another, the physician can identify disease and assess its magnitude.
![]()
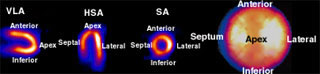
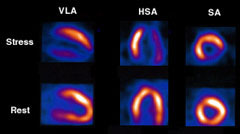
Let us pause and examine actual thallium stress test image(above). First, let us look at the three standard views (VLA, HLA and SA, as discussed above) of the left ventricle. In the VLA view one sees the anterior wall on top and the inferior wall is below. The two walls meet at the apex or tip of the heart. In the HSA view, the septum is to the left and the lateral wall is to the right and they meet at the apex. In the SA view, the anterior, inferior, septum and lateral walls are above, below, left and right, respectively (see above).
The "pizza" appearing picture on the far right is the "bull's eye" image. The center of the bulls eye is the apex of the heart. The computer "slices" the heart in the SA view and "lays" the slices or rings down, one by one, beginning at the tip and moving upwards to the base (widest portion) of the heart. The representative walls are similar to that seen in the SA view. Colors ranging from orange to white are "hot colors" and represent normal blood flow. Dark shades of orange, brown, blue and black are "cold" colors and represent little to no flow. Ignore the bluish halo surrounding the heart slices above because they are NOT WITHIN the walls of the left ventricle (LV).
![]()
The physician can separate a normal left ventricle, from ischemia (live muscle with flow that is compromised only during exercise) and the scar tissue of a heart attack. The distinction is made in the following way:
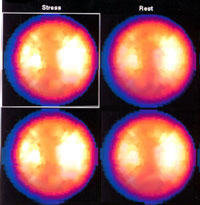
NORMAL = Both the resting and stress images show uniform uptake through out the heart, as shown above. In comparison, the rest images do not show a localized area of increased isotope uptake. These findings are demonstrated in the stress (top) and rest (bottom) slices or tomograms (tomos; the round pizza shaped images).
The top two circular images on the left show normal uniform uptake of the isotope. The entire heart is either a bright shade of orange, yellow or white. The blue outer halo is outside the walls of the LV and have no clinical importance.
Since everything is within normal limits, the lower images do not demonstrate any blacked out area.
![]()
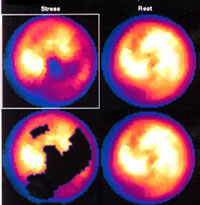
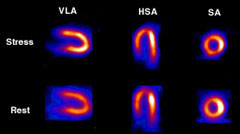
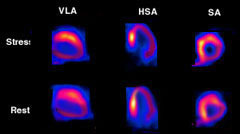
ISCHEMIA: = The top strip of the tomos or tomograms (stress images) are abnormal. They show dark colors in the inferior wall (bottom surface) and apex or tip (VLA view), and lateral wall in the HSA view and the lower lateral wall in the SA view. Thus, there is evidence of reduced blood flow to the inferior, apex and lateral walls. In comparison, the rest images show near normalization of all three segments (which regain brighter colors). This is a typical finding in a patient with ischemia or reversible stress-induced reduction of blood supply to the LV. The four circular or bulls-eye images confirm these findings. The top left circle shows reduced flow (darker colors) in the apex, inferior and lower (posterior) lateral wall of the LV. These areas brighten up (normalize) in the top right (Rest) view. This patient has not had a heart attack but the walls are threatened or jeopardized. The blackened areas in the lower two circles are generated by the computer, which conveniently marks the abnormal areas in the Stress (lower left) but not in the "normalized" Rest (lower right) image.
![]()
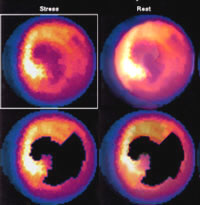
HEART ATTACK: = The top strip of the tomo slices (stress images) show that the inferior, apex and lower lateral walls of the LV have dark colors. It also appears thinner than the normal walls because of reduced blood flow and consequent decrease in tracer uptake. Notice that these findings persist in the rest or lower strips. In other words, there is no reversibility of flow in the Rest images. Such findings indicate a previous heart attack. Also, in the absence of reversibility there is no evidence of additional threatened or jeopardized heart muscle. The four circular or bulls-eye images confirm these findings. The top left circle shows reduced flow (darker colors) in the apex, inferior and lower (posterior) lateral wall of the LV. The changes are fixed and do not change in the rest images (top right). The blackened areas in the lower two circles are generated by the computer which conveniently marks the abnormal areas. Once again, there is no significant change between the Stress and Rest pictures (unlike what we observed in the case of ischemia).
![]()
Preparing for an Isotope Stress Test: The following recommendations are "generic" for all types of cardiac stress tests:
- Do not eat or drink for three hours prior to the procedure. This reduces the likelihood of nausea that may accompany strenuous exercise after a heavy meal. Diabetics, particularly those who use insulin, will need special instructions from the physician's office.
- Specific heart medicines may need to be stopped one or two days prior to the test. Such instructions are generally provided when the test is scheduled by the doctor's office. Call if you have any questions.
- Wear comfortable clothing and shoes that are suitable for exercise.
- An explanation of the test is provided and the patient is asked to sign a consent form.
How long does the entire test take? A patient should allow approximately two to four hours for the entire test, including the preparation. Dual isotope and technetium stress testing takes less time than thallium. You will be allowed to leave the lab and get a light snack or lunch in cases of thallium stress testing.
How safe is an Isotope Treadmill Stress Test? The patient is exposed to a very small amount of radiation and the risk is minimal, if any. The risk of the stress portion of the test is very small and similar to what you would expect from any strenuous form of exercise (jogging in your neighborhood, running up a flight of stairs, etc.). As noted earlier, experienced medical staff is in attendance to manage rare complications like sustained abnormal heart rhythm, unrelieved chest pain or even a heart attack. In such cases, the patient is better off having the problem in the presence of experienced staff, rather than have it happen when they are exercising alone.
![]()
What is the reliability of an Isotope Stress Test? If a patient is able to achieve the target heart rate and good quality images are obtained, an isotope treadmill stress test is capable of diagnosing important disease in approximately 85% of patients with coronary artery Approximately 10% of patients may have a "false-positive" test (when the result is falsely abnormal in a patient without coronary artery disease). Technical problems can occur when a patient is markedly overweight. Women may have an abnormality in the front portion of the heart because of overlying breast tissue. Some men may demonstrate an inferior wall abnormality because of a prominent diaphragm (muscular partition that separates the chest cavity from the abdomen). Patients who have a left bundle branch block on their EKG may also have a false abnormal test.
How quickly will I get the results and what will it mean? The physician performing the stress test can give you a preliminary report about the EKG portion of your test. However, the official result from the isotope scans may take a few days to complete. The results may influence your physician's decision to change your treatment or recommend additional testing such as cardiac catheterization, or a change in your medications.
Panoramic View of Patient Having an Isotope Stress Test
You may pause, pan left and right by dragging your mouse within the panoramic picture.
![]()
©1999-2017, 20XXA.S.M. Systems, Inc. All Rights Reserved, including design and all graphic contents & animations